What Are Technical Indicators? A Powerful & Smart Guide for Traders
A Practical and Powerful Guide for Smarter Trading Decisions
— By Bitcoinalyst
Technical indicators are some of the most widely used tools in trading, especially when we talk about technical analysis — yet also some of the most misunderstood.
Many traders overload their charts with indicators, while others avoid them completely.
In this guide, you’ll learn what technical indicators are, how professionals actually use them, when they help, and when they hurt your performance. This is a clear, practical explanation — not indicator hype.
What Are Technical Indicators?
Technical indicators are mathematical calculations applied to price, volume, or open interest. They are designed to help traders interpret market behavior, not predict it with certainty.
Indicators are derived from:
- Price
- Volume
- Time
In simple terms:
Technical indicators translate raw price data into visual signals that help traders make more informed decisions.
They do not replace price action or market structure — they complement them.
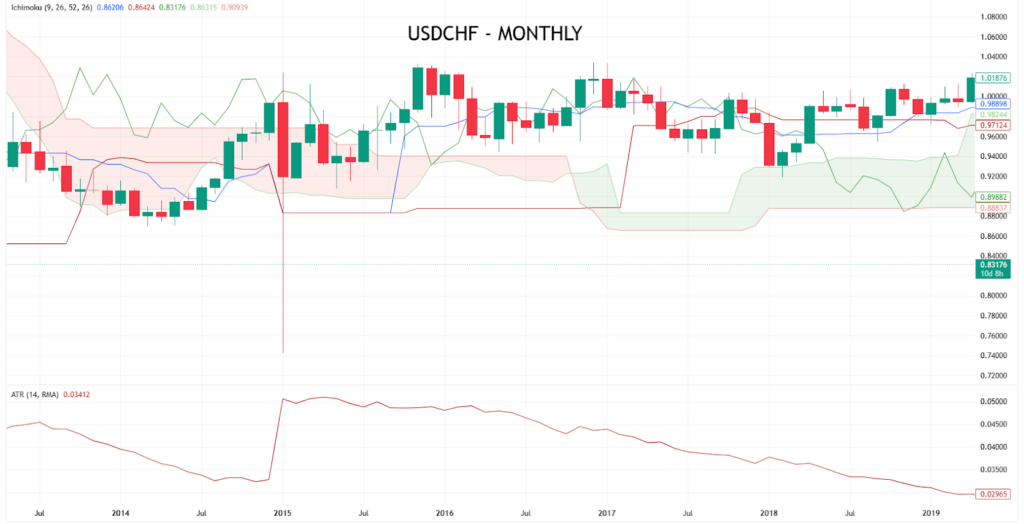
Figure 1: Ichimoku Cloud (trend + support/resistance) and ATR (volatility) shown together — combining directional bias with volatility context.
Major Categories of Technical Indicators
Technical indicators are tools that help traders interpret price action in a rule-based way. They are broadly categorised into trend, momentum, and volatility indicators — each offering different insights.
We’ve included the most common indicators across each category, including typical parameters and what they mean, so new traders can replicate them more confidently.
For a full walkthrough of how MACD and RSI work together in practice, consider taking a look at our: MACD + RSI Divergence post.
1. Trend Indicators
Help traders identify the direction and strength of a market move.
- Moving Averages (MA)
Smooth out price data over a set period to show overall direction.
Typical Parameters:
- 50-period SMA (slow trend)
- 200-period SMA (macro trend)
- 9 or 20 EMA (short-term trend)
What This Means:
The higher the number, the more historical price is averaged, making the MA slower and smoother.
- MACD (Moving Average Convergence Divergence)
Highlights trend momentum and crossover signals.
Typical Parameters:
- 12 (fast EMA), 26 (slow EMA), 9 (signal line)
What This Means:
MACD line = 12 EMA – 26 EMA
Signal line = 9-period EMA of the MACD
Histogram = difference between MACD and signal line
Example: The MACD below shows the MACD line (blue), signal line (orange), and histogram. Annotated callouts explain how crossover signals and momentum shifts are interpreted.
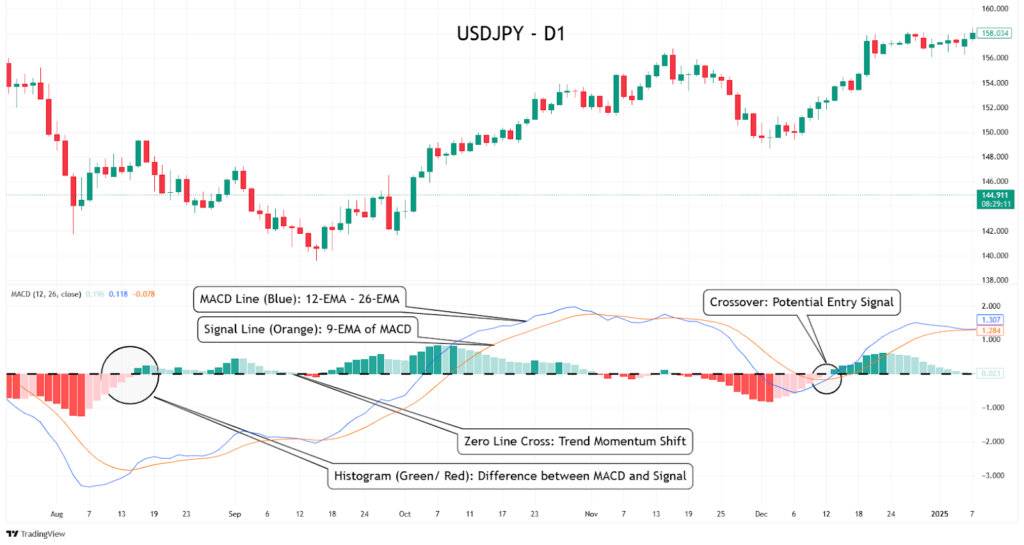
Figure 1: MACD signals, histogram dynamics, and zero-line momentum shifts.
2. Momentum Indicators
Measure the speed of price movement — useful for spotting overbought or oversold conditions.
- Relative Strength Index (RSI)
Compares recent gains and losses to determine bullish or bearish pressure.
Typical Parameters:
- 14-period
What This Means:
RSI outputs a score from 0–100.
Above 70 = overbought. Below 30 = oversold. The 50 midline acts as trend confirmation.
- Stochastic Oscillator
Compares the current closing price to its recent high/low range.
Typical Parameters:
- %K = 14, %D = 3
What This Means:
%K is the main line, %D is the 3-period moving average of %K.
Overbought = above 80, Oversold = below 20.
Example: This RSI chart includes annotations for overbought and oversold zones, midline bias filtering, and potential reversal signals.
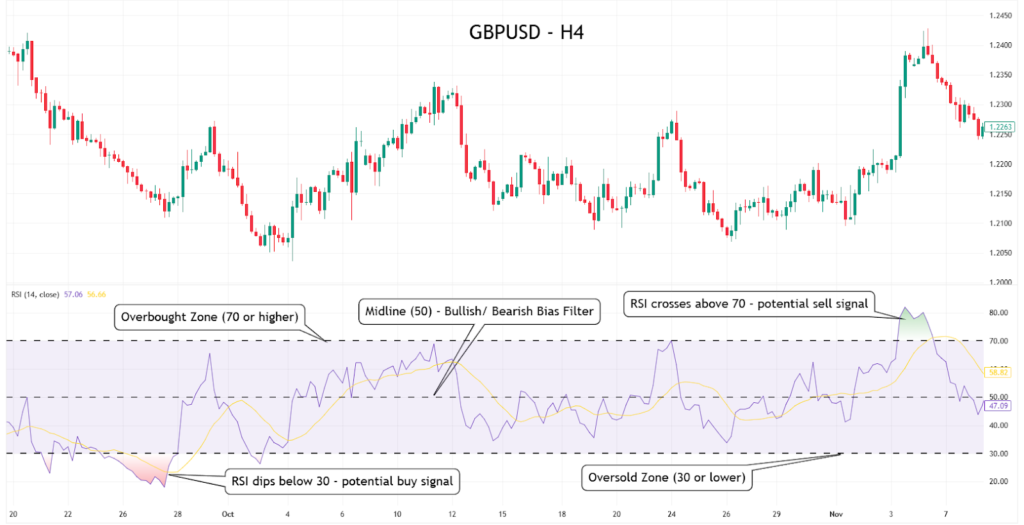
Figure 2: RSI chart identifying overbought/oversold zones and key momentum signal triggers.
3. Volatility Indicators
Show how much price is moving — not in direction, but in magnitude.
- Bollinger Bands
Defines a dynamic range around price using standard deviation.
Typical Parameters:
- 20-period SMA, 2 standard deviations
What This Means:
The bands expand and contract with volatility. Price touching outer bands may signal extremes.
- ATR (Average True Range)
Measures average volatility over a given period.
Typical Parameters:
- 14-period
What This Means:
The higher the ATR, the more volatile the market. It’s not directional — only magnitude.
Example: The Bollinger Bands chart below highlights potential reversal points at the upper and lower bands, as well as the role of the midline (SMA).
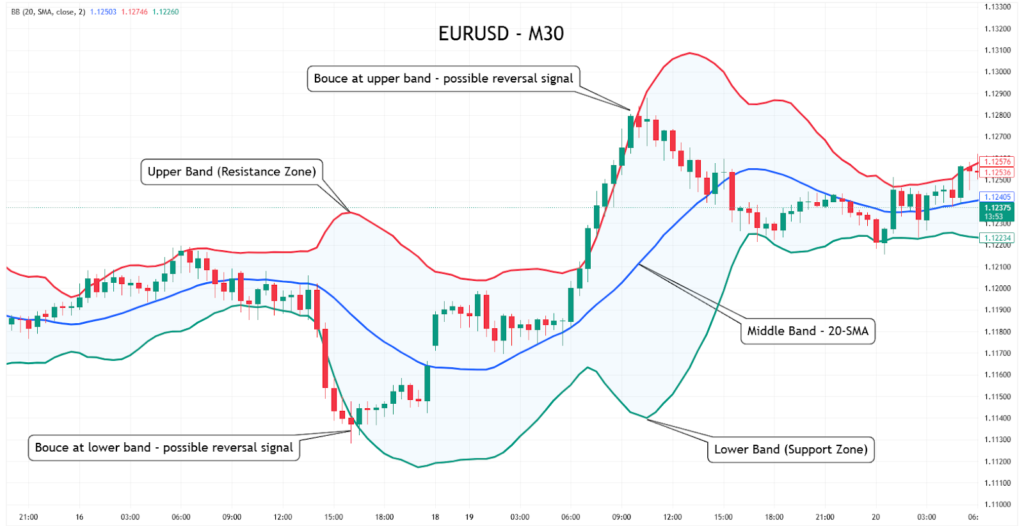
Figure 3: Bollinger Bands example showing volatility boundaries and bounce-based reversal setups.
Key Uses of Technical Indicators
When used correctly, technical indicators add structure and confirmation to a trading plan.
Confirmation, Not Prediction
Professional traders use indicators to:
- Confirm price action setups
- Validate trend direction
- Filter low-quality trades
Indicators work best after price has already shown intent.
Trade Management
Indicators are excellent for:
- Managing exits
- Adjusting stop losses
- Measuring volatility
For example, ATR-based stops adapt to market conditions instead of using fixed pip values.
Consistency and Discipline
In prop trading and funded accounts, indicators help:
- Reduce emotional decision-making
- Follow repeatable rules
- Maintain consistency
This is why many prop firms allow indicators but discourage indicator-only systems.
When Not to Rely on Indicators
Indicators become dangerous when traders:
- Use too many at once
- Ignore price structure
- Chase signals without context
Indicators Lag
Most indicators are lagging — they react to price, not lead it. This means:
- Signals appear after moves begin
- Late entries increase risk
Ranging and News Conditions
Indicators perform poorly when:
- Markets are ranging with low volatility
- High-impact news causes sharp spikes
In these conditions, price action and support/resistance outperform indicators.
Indicator Dependency
If you cannot explain why a trade works without an indicator, the indicator is controlling you — not helping you.
Summary Points (Key Takeaways)
- Technical indicators are tools, not strategies
- They are best used as confirmation
- Different indicators serve different purposes
- Overuse reduces clarity and performance
- Price action always comes first
The best traders use few indicators, with clear purpose.
Final Thoughts from Bitcoinalyst
Indicators are not shortcuts.
They are decision aids.
When combined with price action and market structure, technical indicators can improve clarity and discipline. When used alone, they often create confusion.
Master price first.
Use indicators second.
Trade with intention.