What Is Technical Analysis? A Clear and Practical Guide for Traders
Price Action, Market Structure, and Why It Matters in Prop Trading
— By Bitcoinalyst
Technical analysis is one of the most important skills any trader can learn.
Whether you trade forex, crypto, indices, or futures — and especially if you trade funded accounts or prop firms — understanding price behavior is not optional. It’s essential.
In this guide, I’ll break technical analysis down in a simple, practical, and professional way, focusing on how real traders use it every day — not theory, not indicators overload.
Keypoints:
- Technical analysis studies price movement using historical data and chart structure.
- Key elements include trends, patterns, support/resistance, and candlesticks.
- Understanding timeframes and chart types helps traders match setup to strategy.
- TA provides the structure needed to plan and execute trades with discipline.
What Is Technical Analysis?
Technical analysis is the study of price movement using charts.
Instead of focusing on news or economic reports, technical traders analyze price, time, and market behavior to make decisions.
At its core, technical analysis is based on three principles:
- Price discounts everything
- Price moves in trends
- History tends to repeat itself
When traders ask “what is technical analysis?”, the simplest answer is this:
Technical analysis helps traders identify where price is likely to go next by studying what it has already done.
This approach is widely used by professional traders, institutions, and — most importantly — prop trading firms, where strict risk rules require precision and consistency.
Price Action and Market Structure
What Is Price Action?
Price action is the purest form of technical analysis.
It focuses on candlestick movement, highs, lows, and momentum, without relying heavily on indicators.
Price action traders read:
- Candlestick patterns
- Impulsive vs corrective moves
- Breaks and rejections of key levels
This makes price action ideal for traders who want clarity and control — especially in funded trading accounts.
Market Structure Explained Simply
Market structure describes how price moves over time:
- Higher highs + higher lows → Uptrend
- Lower highs + lower lows → Downtrend
- Equal highs/lows → Range
Understanding market structure helps you:
- Trade with the trend
- Avoid fighting momentum
- Identify trend reversals early
In prop trading, market structure is critical because drawdown limits are strict — trading against structure often leads to unnecessary losses.
Let’s explore the four foundational market conditions in more detail — along with annotated chart examples for each.
Basic Market Conditions:
| Market Type | Description |
|---|---|
| Trending | Price moves consistently higher or lower |
| Ranging | Price oscillates between support and resistance |
| Breakout | Price breaks out of a defined range |
| Reversal | Trend changes direction |
Example: Trending Market
In a trending market, price steadily pushes in one direction, forming higher highs and higher lows in an uptrend, or lower lows and lower highs in a downtrend.
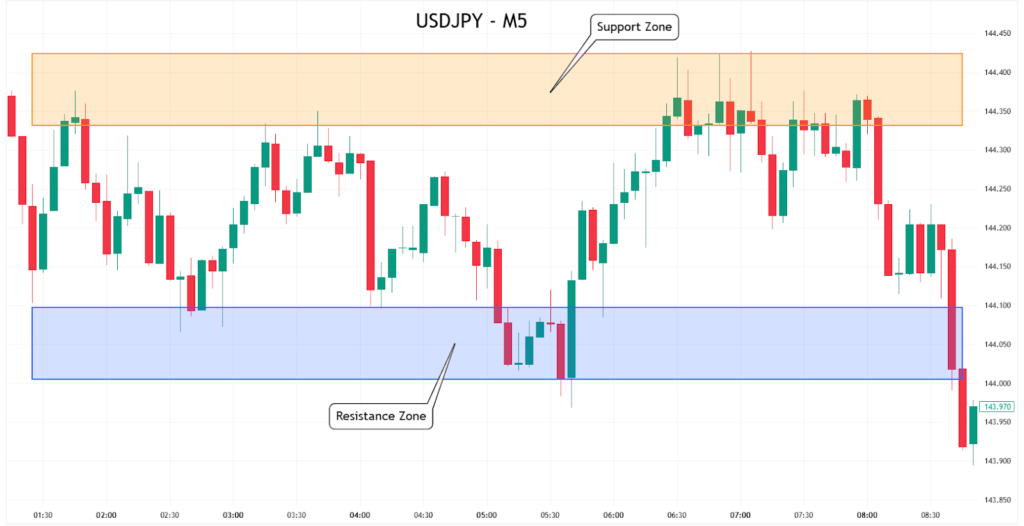
Figure 1: Clear uptrend structure — higher highs and higher lows confirming bullish price action.
Example: Ranging Market
A ranging market occurs when price remains trapped between support and resistance with no clear directional bias. This often signals indecision or consolidation before a move.
Figure 2: Range-bound structure with support and resistance zones marked, showing sideways movement.
Example: Breakout Market
A breakout takes place when price escapes a clearly defined range, often with a strong candle close. Breakouts can mark the start of new trends or continuation after consolidation.
Figure 3: Bullish breakout from consolidation — large candle closes above resistance, initiating upward momentum.

Example: Reversal Pattern
Reversals show a shift in momentum where a prevailing trend ends and price begins to move in the opposite direction. These typically follow exhaustion or a key rejection zone.
Figure 4: Bearish reversal zone after uptrend — breakdown candle signals change in market sentiment.

Each condition represents a different phase of market behaviour. Recognising these setups visually is key to timing entries, identifying structure, and selecting strategies that fit the environment.
Support and Resistance
Support and resistance are the foundation of technical analysis.
- Support = an area where price tends to stop falling
- Resistance = an area where price tends to stop rising
These levels represent areas of high buying or selling interest, not exact lines.
Why Support and Resistance Matter
Support and resistance help traders:
- Define high-probability entries
- Place logical stop losses
- Set realistic profit targets
In funded trading environments, clean support and resistance trading allows you to:
- Control risk precisely
- Avoid emotional decisions
- Meet prop firm consistency rules
The best traders don’t predict — they react at key levels.
These are key price zones where price historically reacts — either stalling, bouncing, or reversing.
- Support: a price floor where demand outweighs selling
- Resistance: a price ceiling where selling pressure overcomes demand
They can be horizontal or dynamic (moving averages, trendlines, etc).
The example below shows horizontal support and resistance zones applied to a short-term USDJPY chart. Notice how price repeatedly tests these zones before reversing or breaking through — a behaviour that forms the basis for many entry, exit, and risk management decisions in technical trading.

Figure 1: Example of horizontal support and resistance zones on a lower timeframe (USDJPY M5) — price reacts repeatedly at these levels.
Chart Types and Timeframes
Common Chart Types
- Candlestick charts (most popular)
- Line charts (basic trend view)
- Bar charts (less commonly used today)
Candlestick charts dominate technical analysis because they clearly show:
- Open
- High
- Low
- Close
They visually represent market psychology in real time.
Choosing the Right Timeframe
Timeframes depend on your trading style:
| Style | Timeframes |
|---|---|
| Scalping | 1m – 5m |
| Day Trading | 5m – 1H |
| Swing Trading | 4H – Daily |
| Position Trading | Daily – Weekly |
Prop traders often combine:
- Higher timeframe bias (4H / Daily)
- Lower timeframe entries (5m / 15m)
This top-down approach improves accuracy and reduces rule violations in funded accounts.
Common Chart Types
- Candlestick: shows open, high, low, close — most widely used
- Line: simple closing price view
- Bar: similar to candlesticks but with different structure
Timeframes
Each chart can be viewed in different time compressions (e.g. 1-minute, 1-hour, daily).
- Short timeframes = more noise, faster signals
- Higher timeframes = broader context, stronger levels
Multi-timeframe analysis is often used to align entry timing with overall structure.

Figure 1: A line chart that displays closing prices over time, connecting each close with a line for a simple, clean view of trend direction.

Figure 2: A bar chart that visualises open, high, low, and close for each period using vertical bars and horizontal ticks.
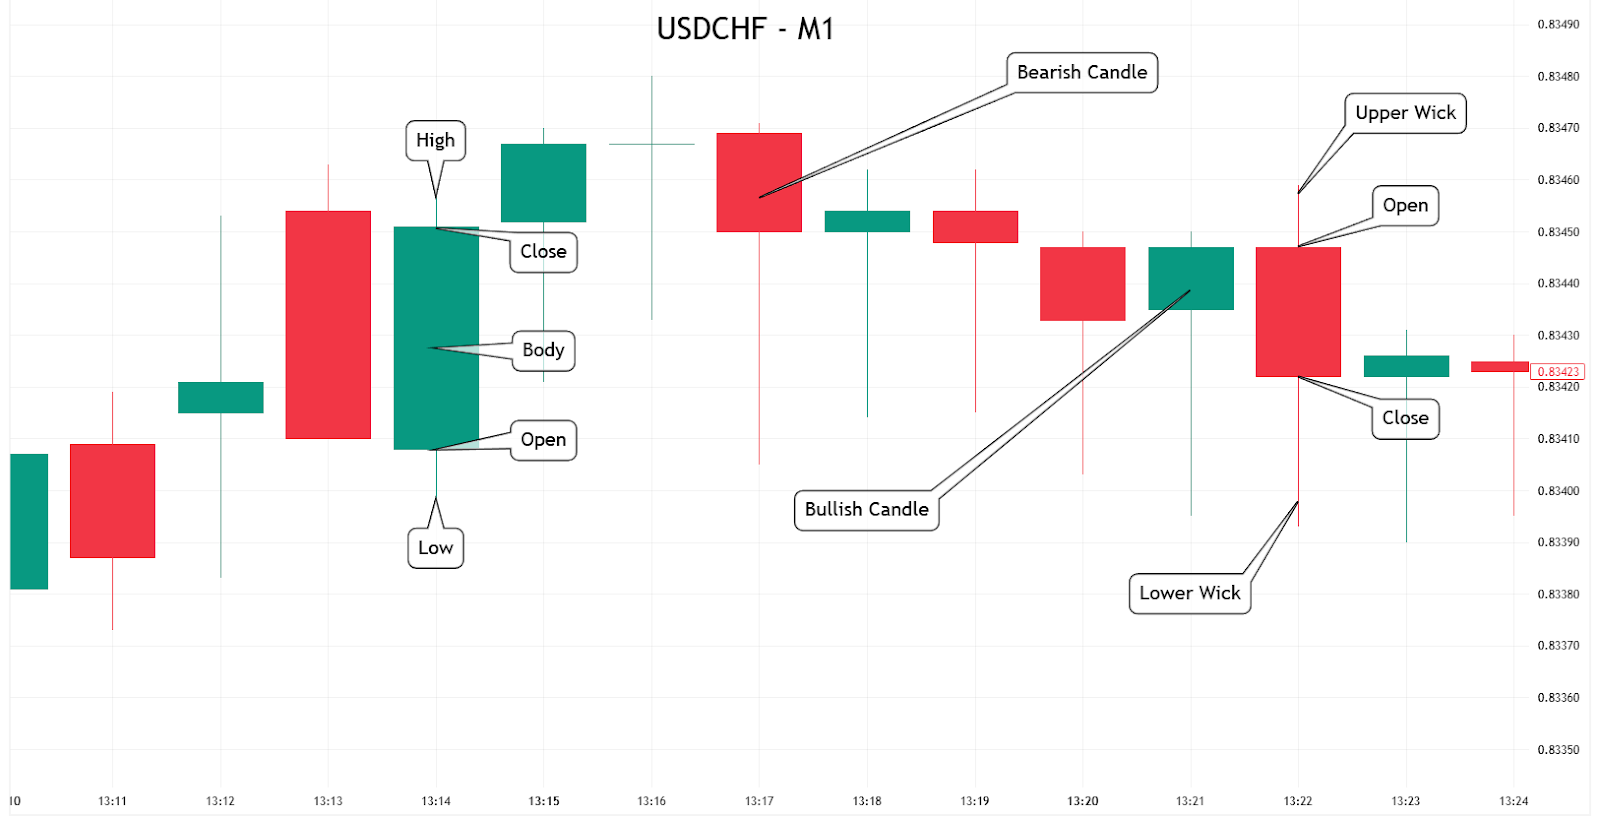
Figure 3: candlestick chart that combines price structure with colour to show bullish or bearish bias via open, close, high, and low.
Why This Matters in Prop Trading
Most prop firm evaluations are passed or failed based on execution discipline — not complex strategies.
Technical analysis in trading gives traders a repeatable process for defining market structure, identifying setups, and placing trades with confidence.
It also makes it easier to define stops, targets, and trade logic, all of which support rule‑based trading and consistency.
Beyond this, technical analysis strengthens trader psychology by reducing hesitation and emotional bias. With a clear chart‑based plan, traders avoid overtrading and respect risk limits.
Ultimately, technical analysis bridges strategy and risk management, proving to prop firms that a trader can manage capital responsibly.
This combination of discipline, structure, and consistency is what turns a funded account into a sustainable trading career.